YouTube Channel Insights
This Power BI dashboard is connected directly to the YouTube Data and Analytics APIs to track key metrics like views, […]
This Power BI dashboard is connected directly to the YouTube Data and Analytics APIs to track key metrics like views, […]
Have you ever taken a moment to think about whether your data visualizations are truly accessible to everyone? In data
Parameter tables are a dynamic tool for manipulating measures in Power BI, offering you the ability to adjust data in
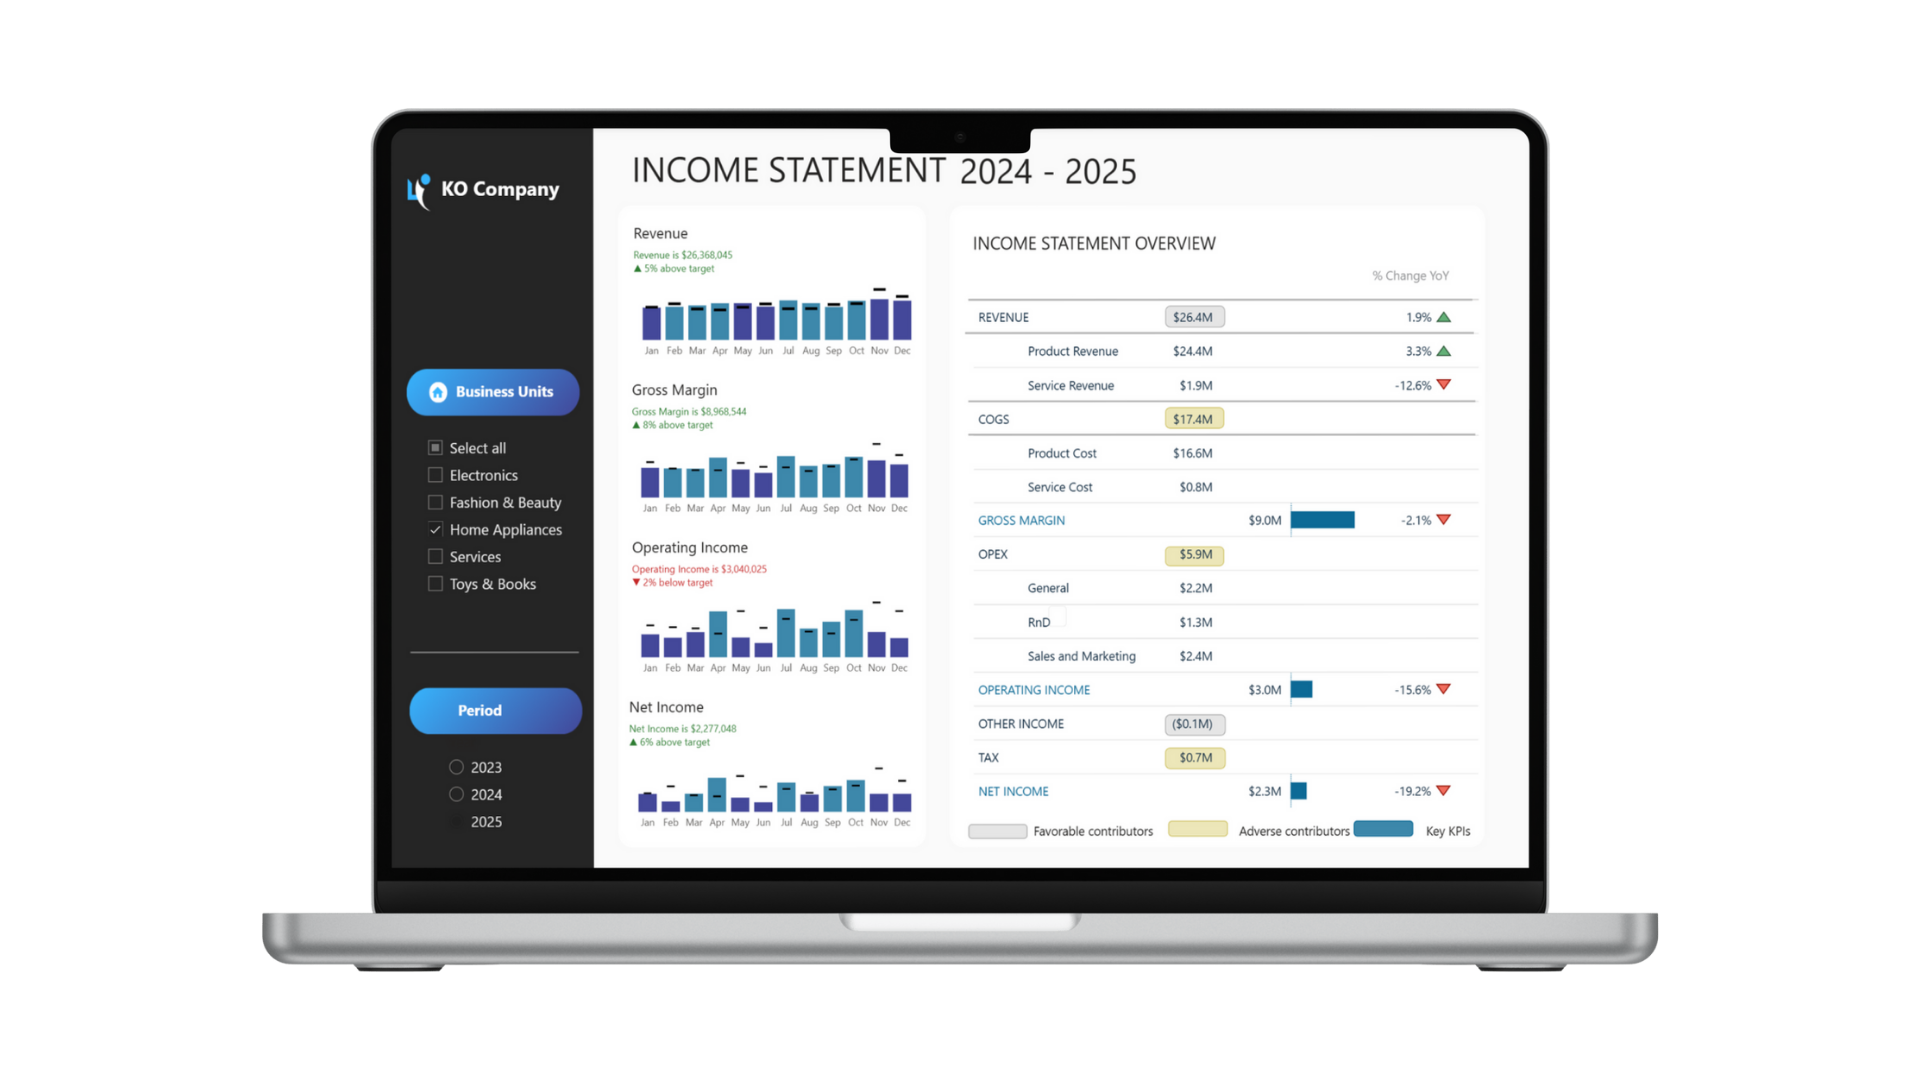
Microsoft’s Power BI is a powerful data analytics tool that lets users create interactive dashboards and insightful reports. It is
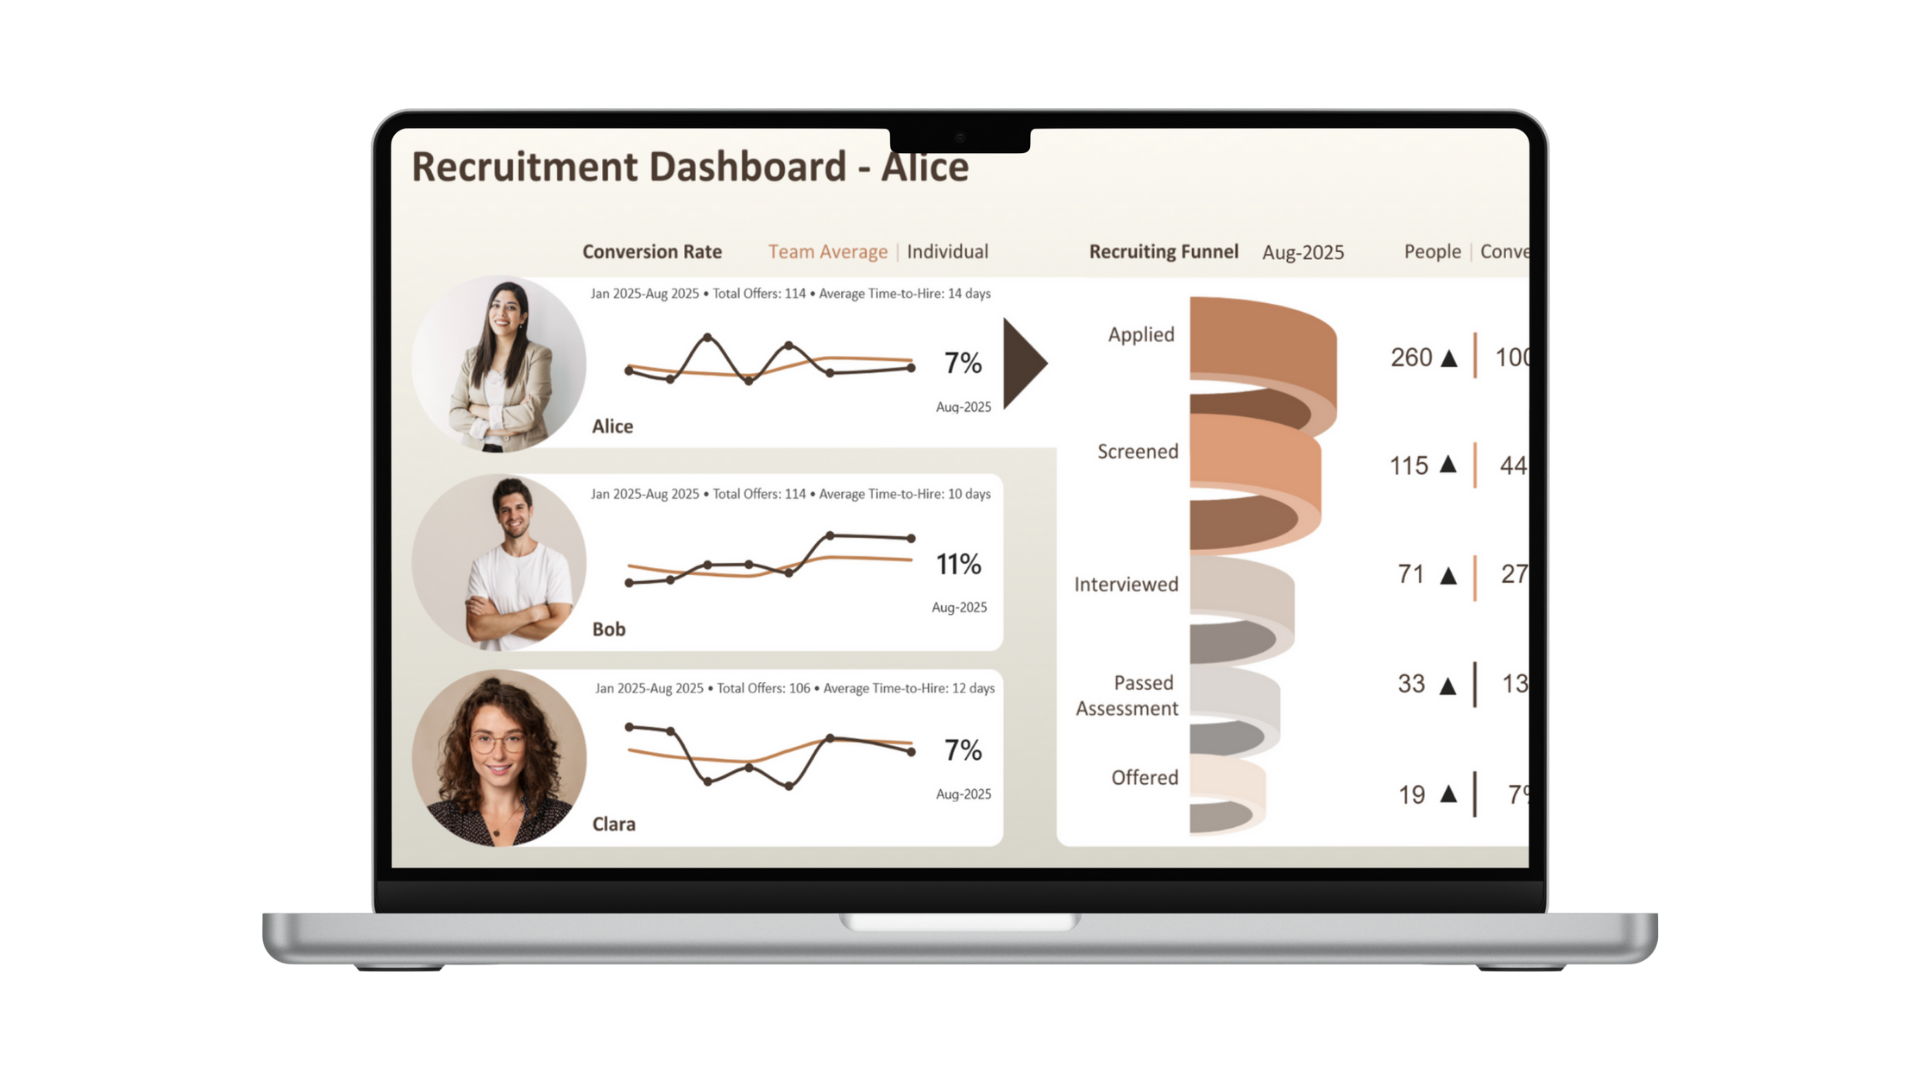
A practical HR dashboard that turns applications, interviews, and offers into guidance you can act on.
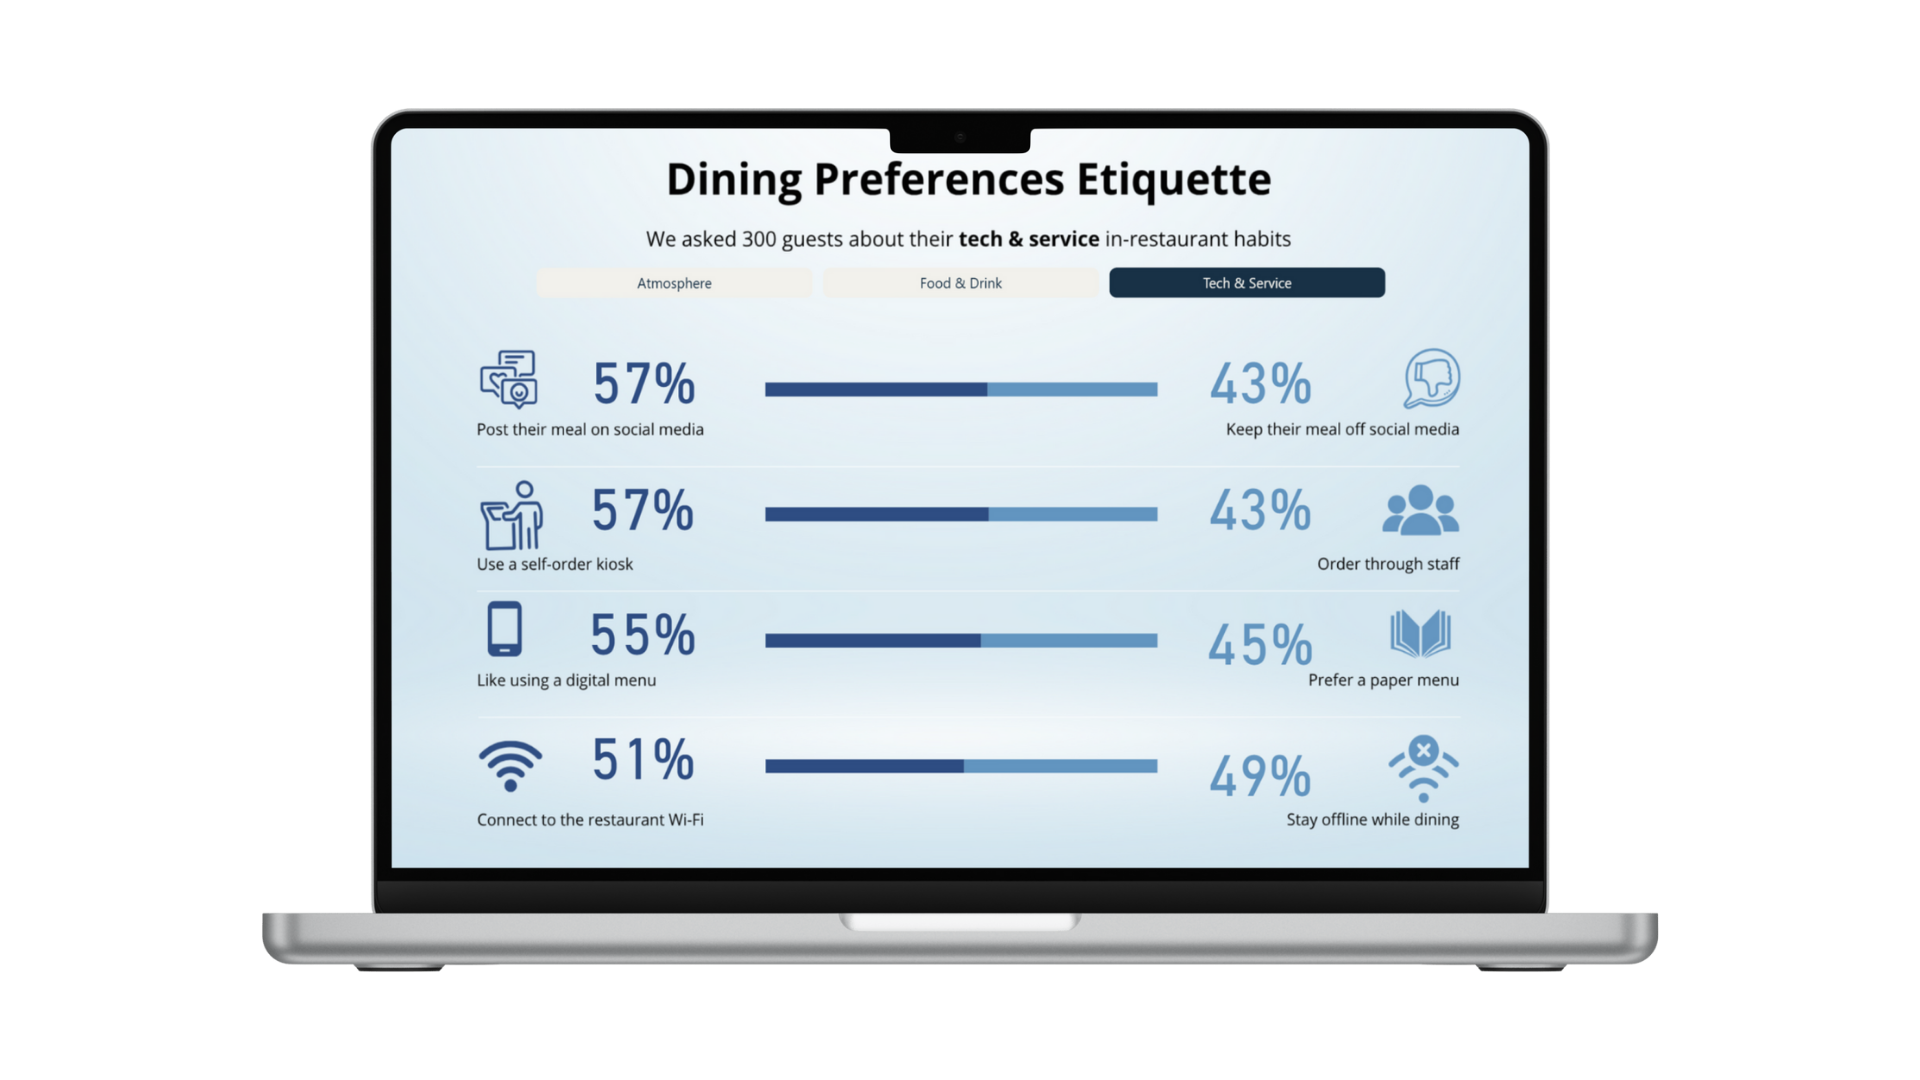
A Power BI story that highlights NPS, key drivers, and real preferences – so managers can act fast and lift loyalty.
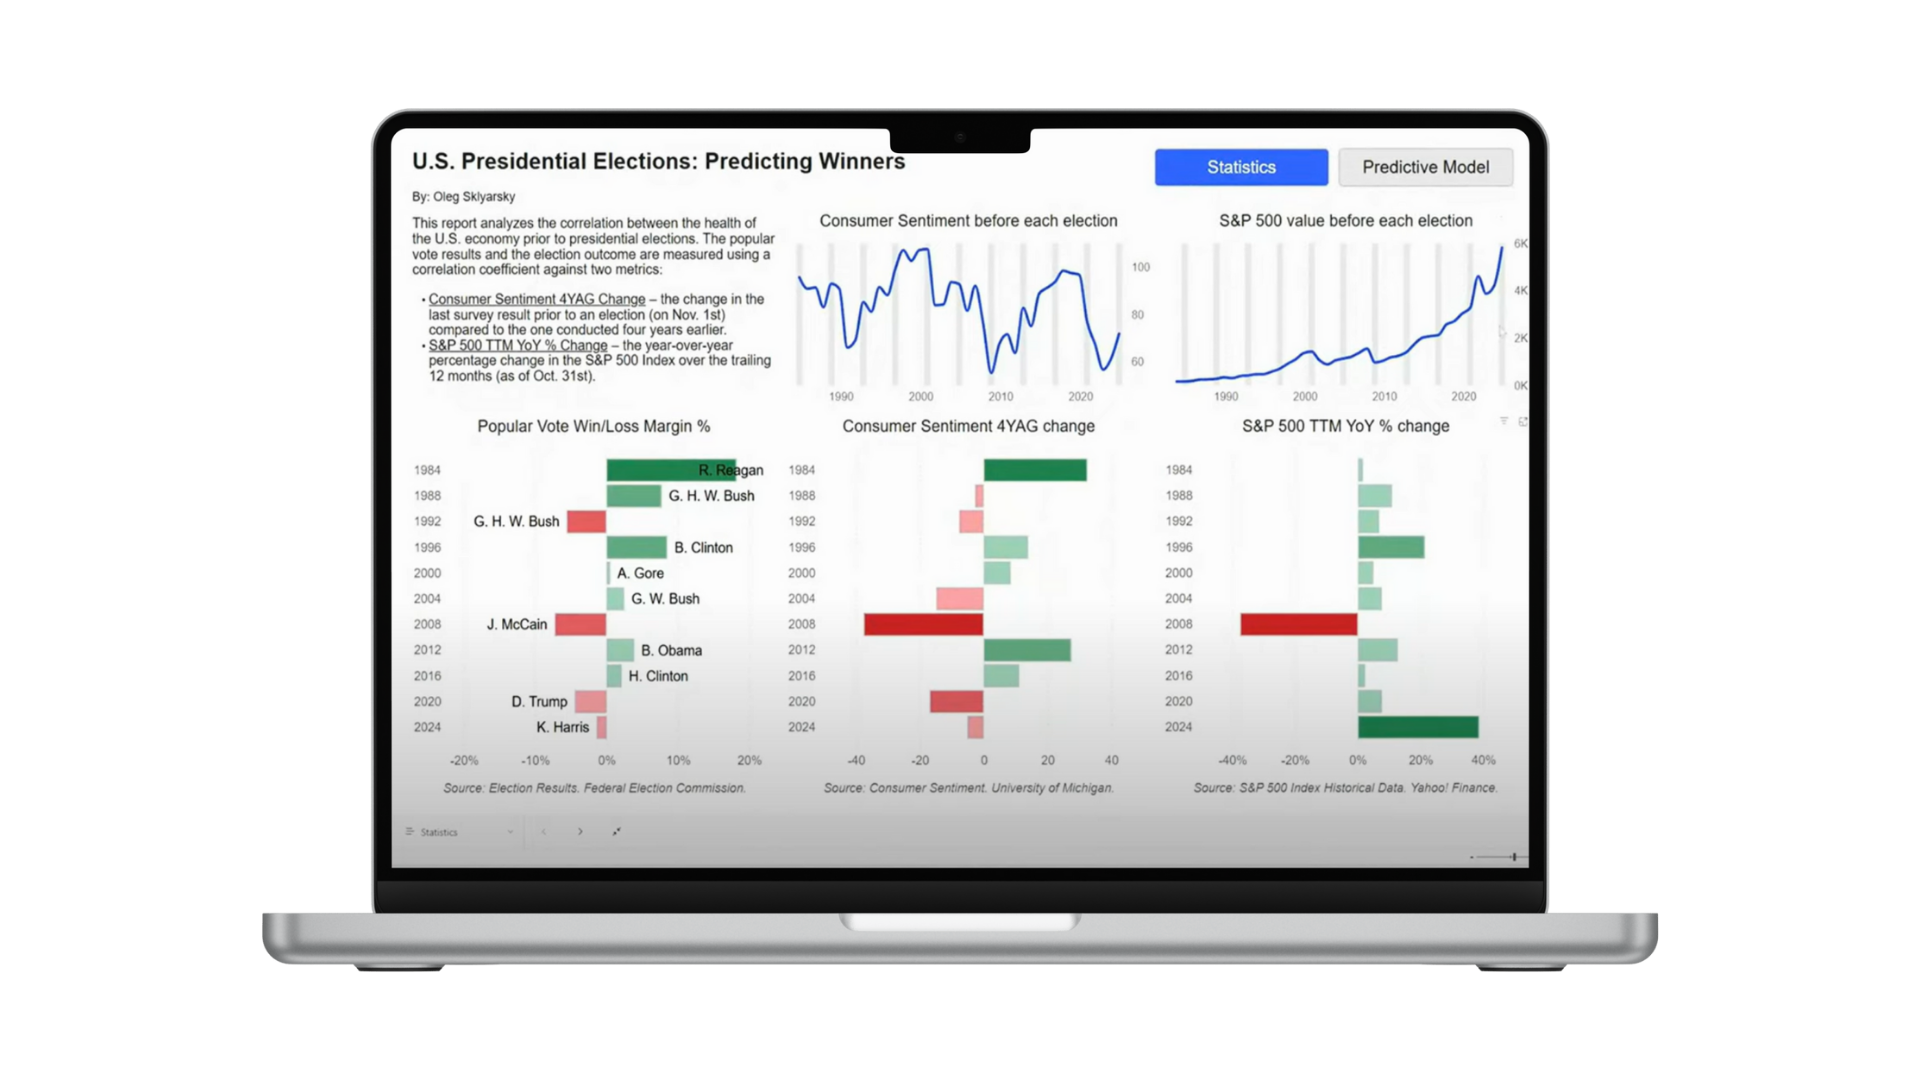
This report examines the relationship between the health of the U.S. economy and the outcomes of presidential elections.
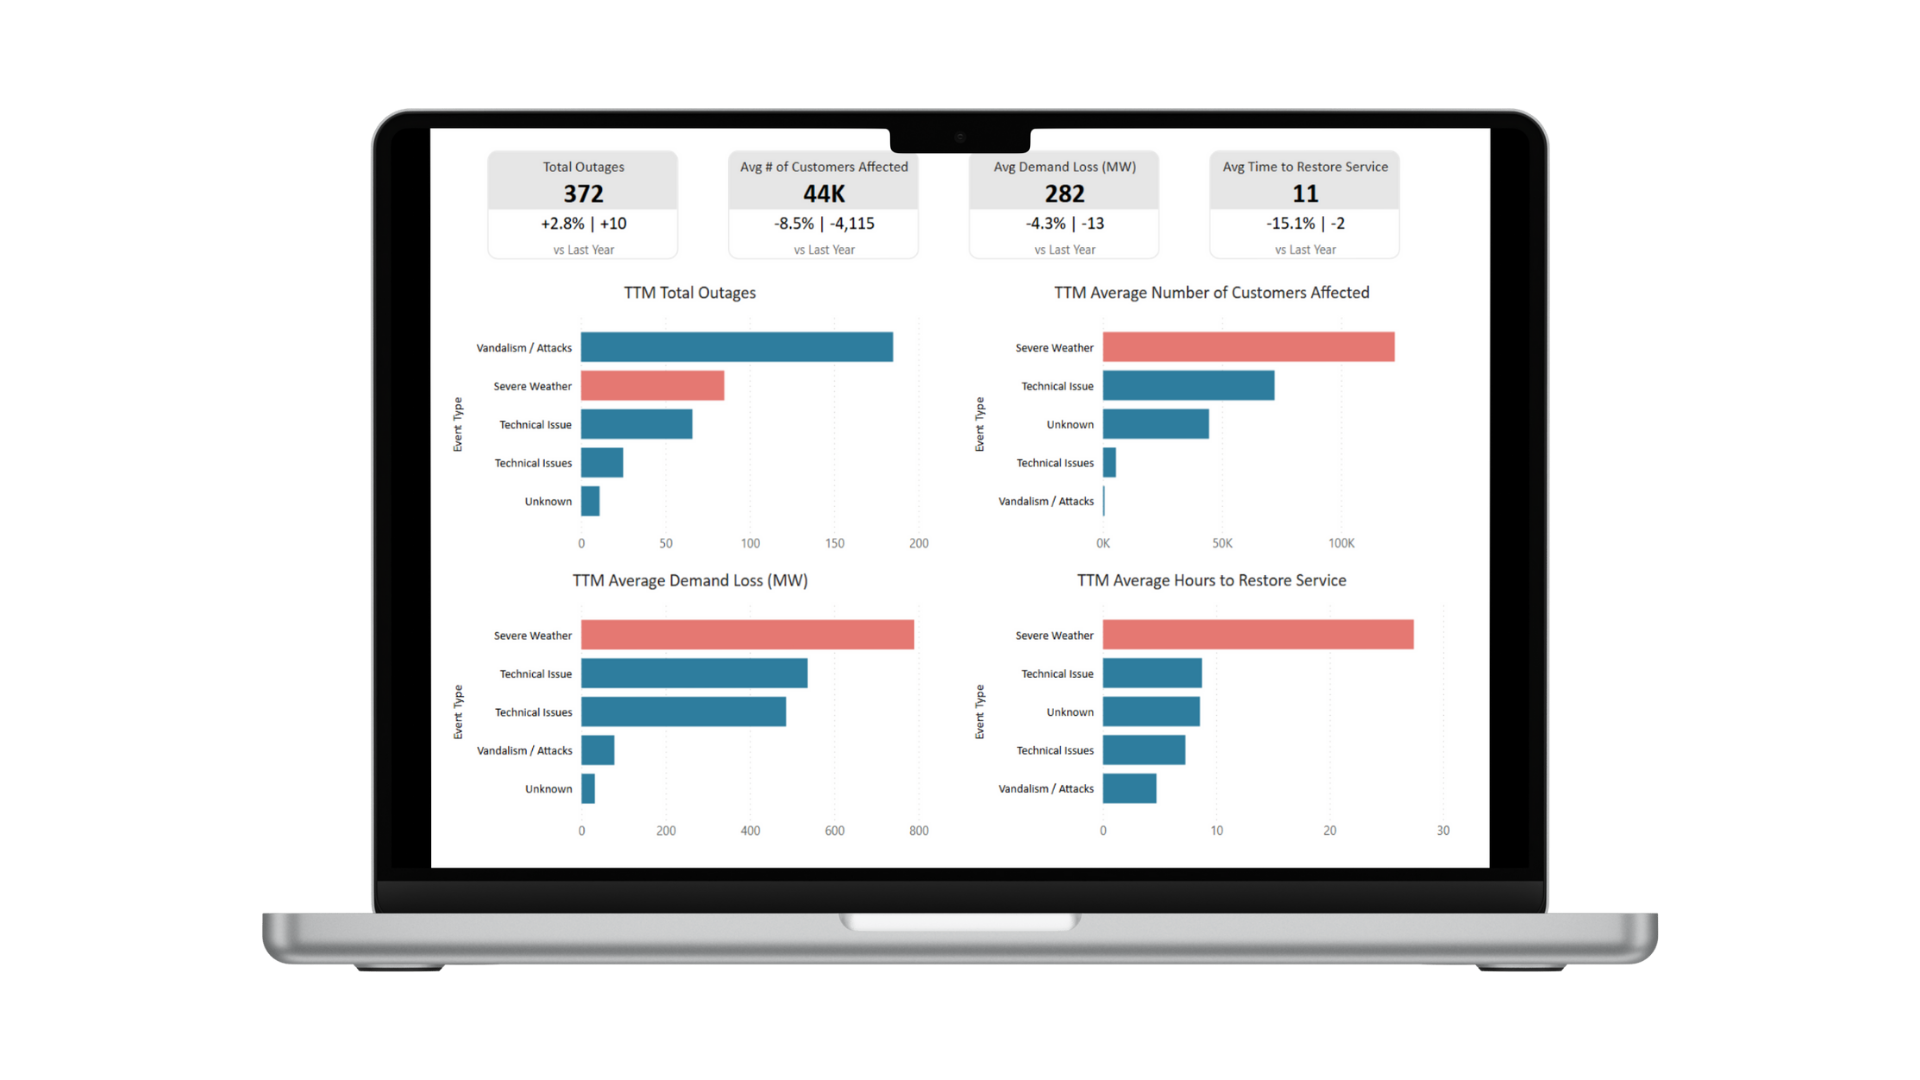
Visualizing key performance indicators and trend analysis to drive data-driven decision-making in retail start-up.